Volume in Time is one of the more powerful PriceSquawk features that lets us hear increased trading activity, or conversely notice decreased market participation. The increased trading activity is usually where discretionary traders like to get involved as it is more likely to result in a swing in price as the short term emotion of the market changes. Increased trading activity in the market is where large traders can manage their positions efficiently and thus they get involved in the market, or orchestrate such market conditions for managing their positions. Trading the order flow is generally about detecting these larger traders and figuring out their expectations of short term market behavior, then getting in for the ride (and getting out if you were wrong of course).
Decreased market activity can say just as much about opportunities. If the market slows down suddenly, this can represent anticipation by the large traders of a market event, whether it be a breakout to new levels, approaching a step in the profile, or a number. A continually slow market tells us that there is not much interest, either everyone is happy in their positions, or there is too much risk to get involved.
It is convenient to monitor these different market conditions with PriceSquawk’s Volume in Time feature, without having to continually scan the screens to come to the same conclusions about market conditions. The trading sound also ensure you do not miss out on any key signs of changes in the market due to the continual projection of market conditions (it is very easy to zone out from the numbers printing in the DOM or Tape for some time). They also keep you focused on present market conditions as opposed to trying to find reasons to place a trade based on historical market information.
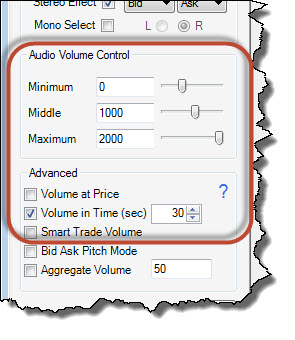
PriceSquawk’s Volume In Time always looks at how much volume has traded over the previous X seconds (X being a setting of 30 seconds by default). You can then set three threshold values to identify changes in the volume trading in a market and hear the increasing and decreasing market participation. These threshold values used are your Minimum, Middle and Maximum settings which determine the loudness of Buying and Selling sounds.
It is quite easy to find some useful settings for the Minimum, Middle and Maximum values based off a chart or market experience however I have been experimenting with market statistics to find the ‘ideal’ settings and have created what I think is a useful indicator for telling us values to use for Minimum, Middle and Maximum. The (NinjaTrader) indicator looks at the volume that traded for each historical bar, and compares it to the same bar in each previous trading session over a certain lookback period. In basic terms the indicator creates a data sample set for each bar in the trading session, and establishes what the normal volume to trade for that bar is by checking if it is in the same range as half of the previous volume values in the sample set. On the close of each bar, if the amount of volume traded is below 50% of the values of previous bars it is considered low volume, and if it within the same range as 50% of previous bars it is considered normal volume. Above 50% of previous values is considered high volume with some more checks thrown in as well. Here is a more technical description you might want to ignore:
Instead of just averaging all the bars with the same timestamp (which can be thrown out by large volume spikes) the indicator looks at the dispersion of these bars to establish what is normal and what is not based on the quartiles of the sample set. The low volume value for each bar is set to the lower quartile value (LQV) and the upper limit for what is considered normal volume is set to the upper quartile value (UQV). The normal range of volume trading is considered the Interquartile Range (IQR) and by definition 50% of the volume values will fall in this range. To establish a high volume value threshold, the indicator uses a sensitivity factor (SF) to determine at what value above 50% of the previous values is considered high volume. In statistics terms this is called looking for outliers, and the sensitivity factor is used to calculate the high volume value = UQV + SF * IQR. Each bar in the trading session will have its own dispersion value, so we smooth the values (using exponential smoothing) to create a continuous line for what is considered low, normal and high volume trading at the close at each bar. We then tell the indicator the period of trading we are interested in (using our charts timezone) for our PriceSquawk settings, and it tells us the average value for low, normal and high volume trading in that period. The Minimum value is set to the low volume value and Middle value to the high volume so that trade sounds will increase when more than normal volume is trading. The Maximum value is set to the high volume value so that the maximum loudness for trade sounds occurs when an unusually high volume is trading.
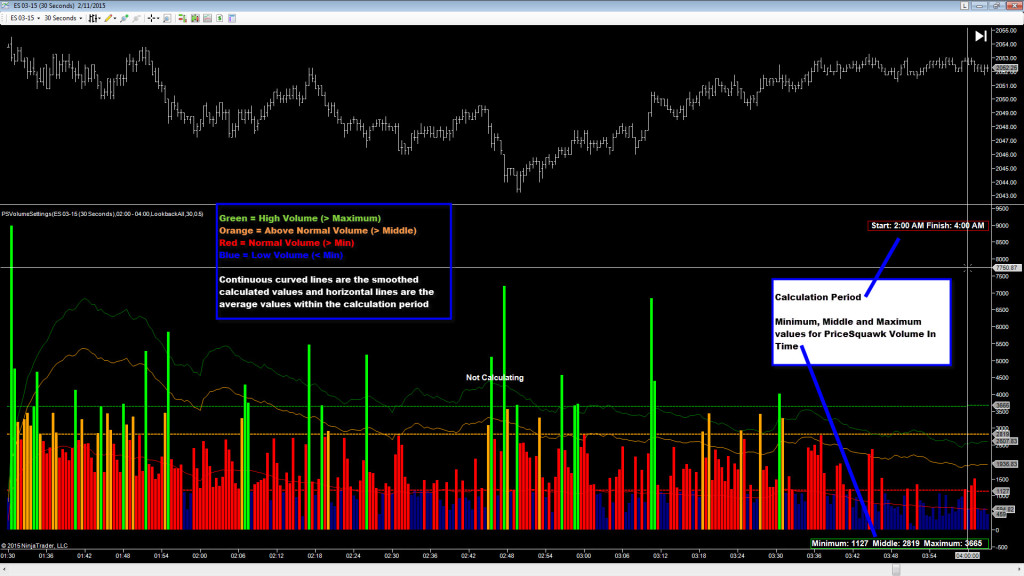
This really just is a simple way to establish what is low, normal and high volume relative to the same time period for each trading session. The statistics help us remove volume spikes from the sample data and establish what the distribution of values is (without complex maths). The smoothed lines create an expected volume value for each bar based on the previous values, and the horizontal lines give us some values to use in PriceSquawk and hear the flow of trading activity.
To use the indicator:
- Download the indicator from the Tools section on the download page and import it into NinjaTrader (File -> Utilities -> Import NinjaScript).
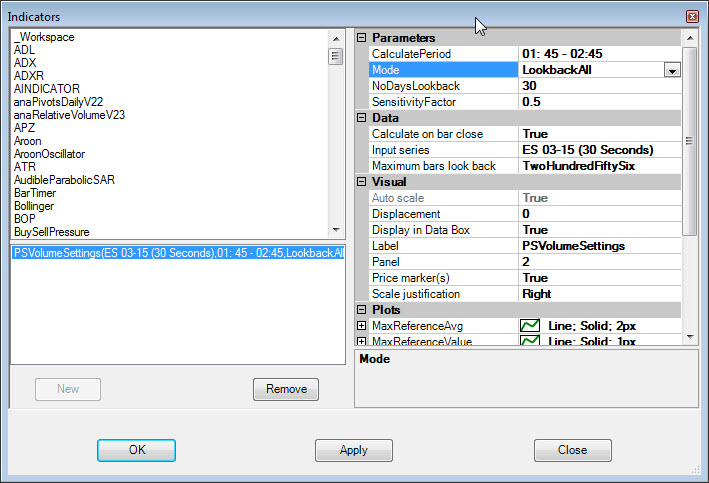
- Add PSVolumeSettings indicator to a bar chart, and set the chart’s time period to the same sample period as your PriceSquawk Volume in Time setting (by default this is 30 seconds).
- Set the Calculate Period value to cover the core of your trading session (be it the morning or afternoon session) and I suggest leaving out the open period. You may want to calculate values for the Morning, Lunch, Afternoon and After Hours trading sessions.
- Use the sensitivity factor to fine tune the Maximum value – and use the chart to check if the green volume bars are useful, as they will represent the maximum buying and selling sounds played.
- Make sure the chart has enough data to satisfy the look-back setting in your indicator properties.
The indicator is not designed to be used as a real time indicator, but instead to analyze historical volume to suggest useful values for use with PriceSquawk to hear the order flow. I suggesting using it at the start of each session, or each week to get your ideal Volume in Time settings for PriceSquawk. As PriceSquawk uses a moving time window, it will be even more responsive to detecting increased trading activity than the indicator, plus you get all the benefits of continuous exposure to the order flow when listening to the market. I plan on adding some more modes to this in the future.
If you have feedback, or ideas for this indicator, or require assistance please use the comments section below.
The software is definitely good. I personally I purchased it for life and happy with its performance.
I also use a software bid ask. Excellent combination. You have to understand that takes time and knowledge to be profitable in the capital market. I see that attempt two weeks and it’s free so I would recommend trying.
I add options should improve the sound across many programs that I should be running for this purpose. Everything should be built-in software so that I can change the sounds H. immediate